‘Data is the new oil’. The fastest growing jobs today are in the field of data analytics, Big Data, Machine Learning and AI. Companies are putting in immense efforts and investments to collect data and it’s paying off handsomely. It is safe to say that Data is going to be a core competency of successful companies. Right from Amazon to political parties to sports, the scope of application of data analytics is infinite.
Cricket is one such domain that is rapidly becoming data driven.
There is a new buzzword that’s gaining a lot of attention these days ‘Criclytics’. Criclytics is basically the marriage of big data and analytics, which is creating a huge uproar in the cricketing universe. Those who watch cricket must have definitely seen the vast amount of statistics that are displayed on the TV screens while the match is on. “India has won 78% of the games when Virat Kohli hits a four on the 2nd ball” or “If McCullum makes less than 50 runs, there is a 74% chance that New Zealand will win” are some examples of what you must have seen. But is this all that the data is being used for, to just showcase interesting statistics? Well, the answer is a big NO. Data is becoming extremely vital in the current era of cricket. Right from what is the right team to be played against a particular team in certain playing conditions to who should bowl the 33rd over of the match are all being assisted by data analytics.
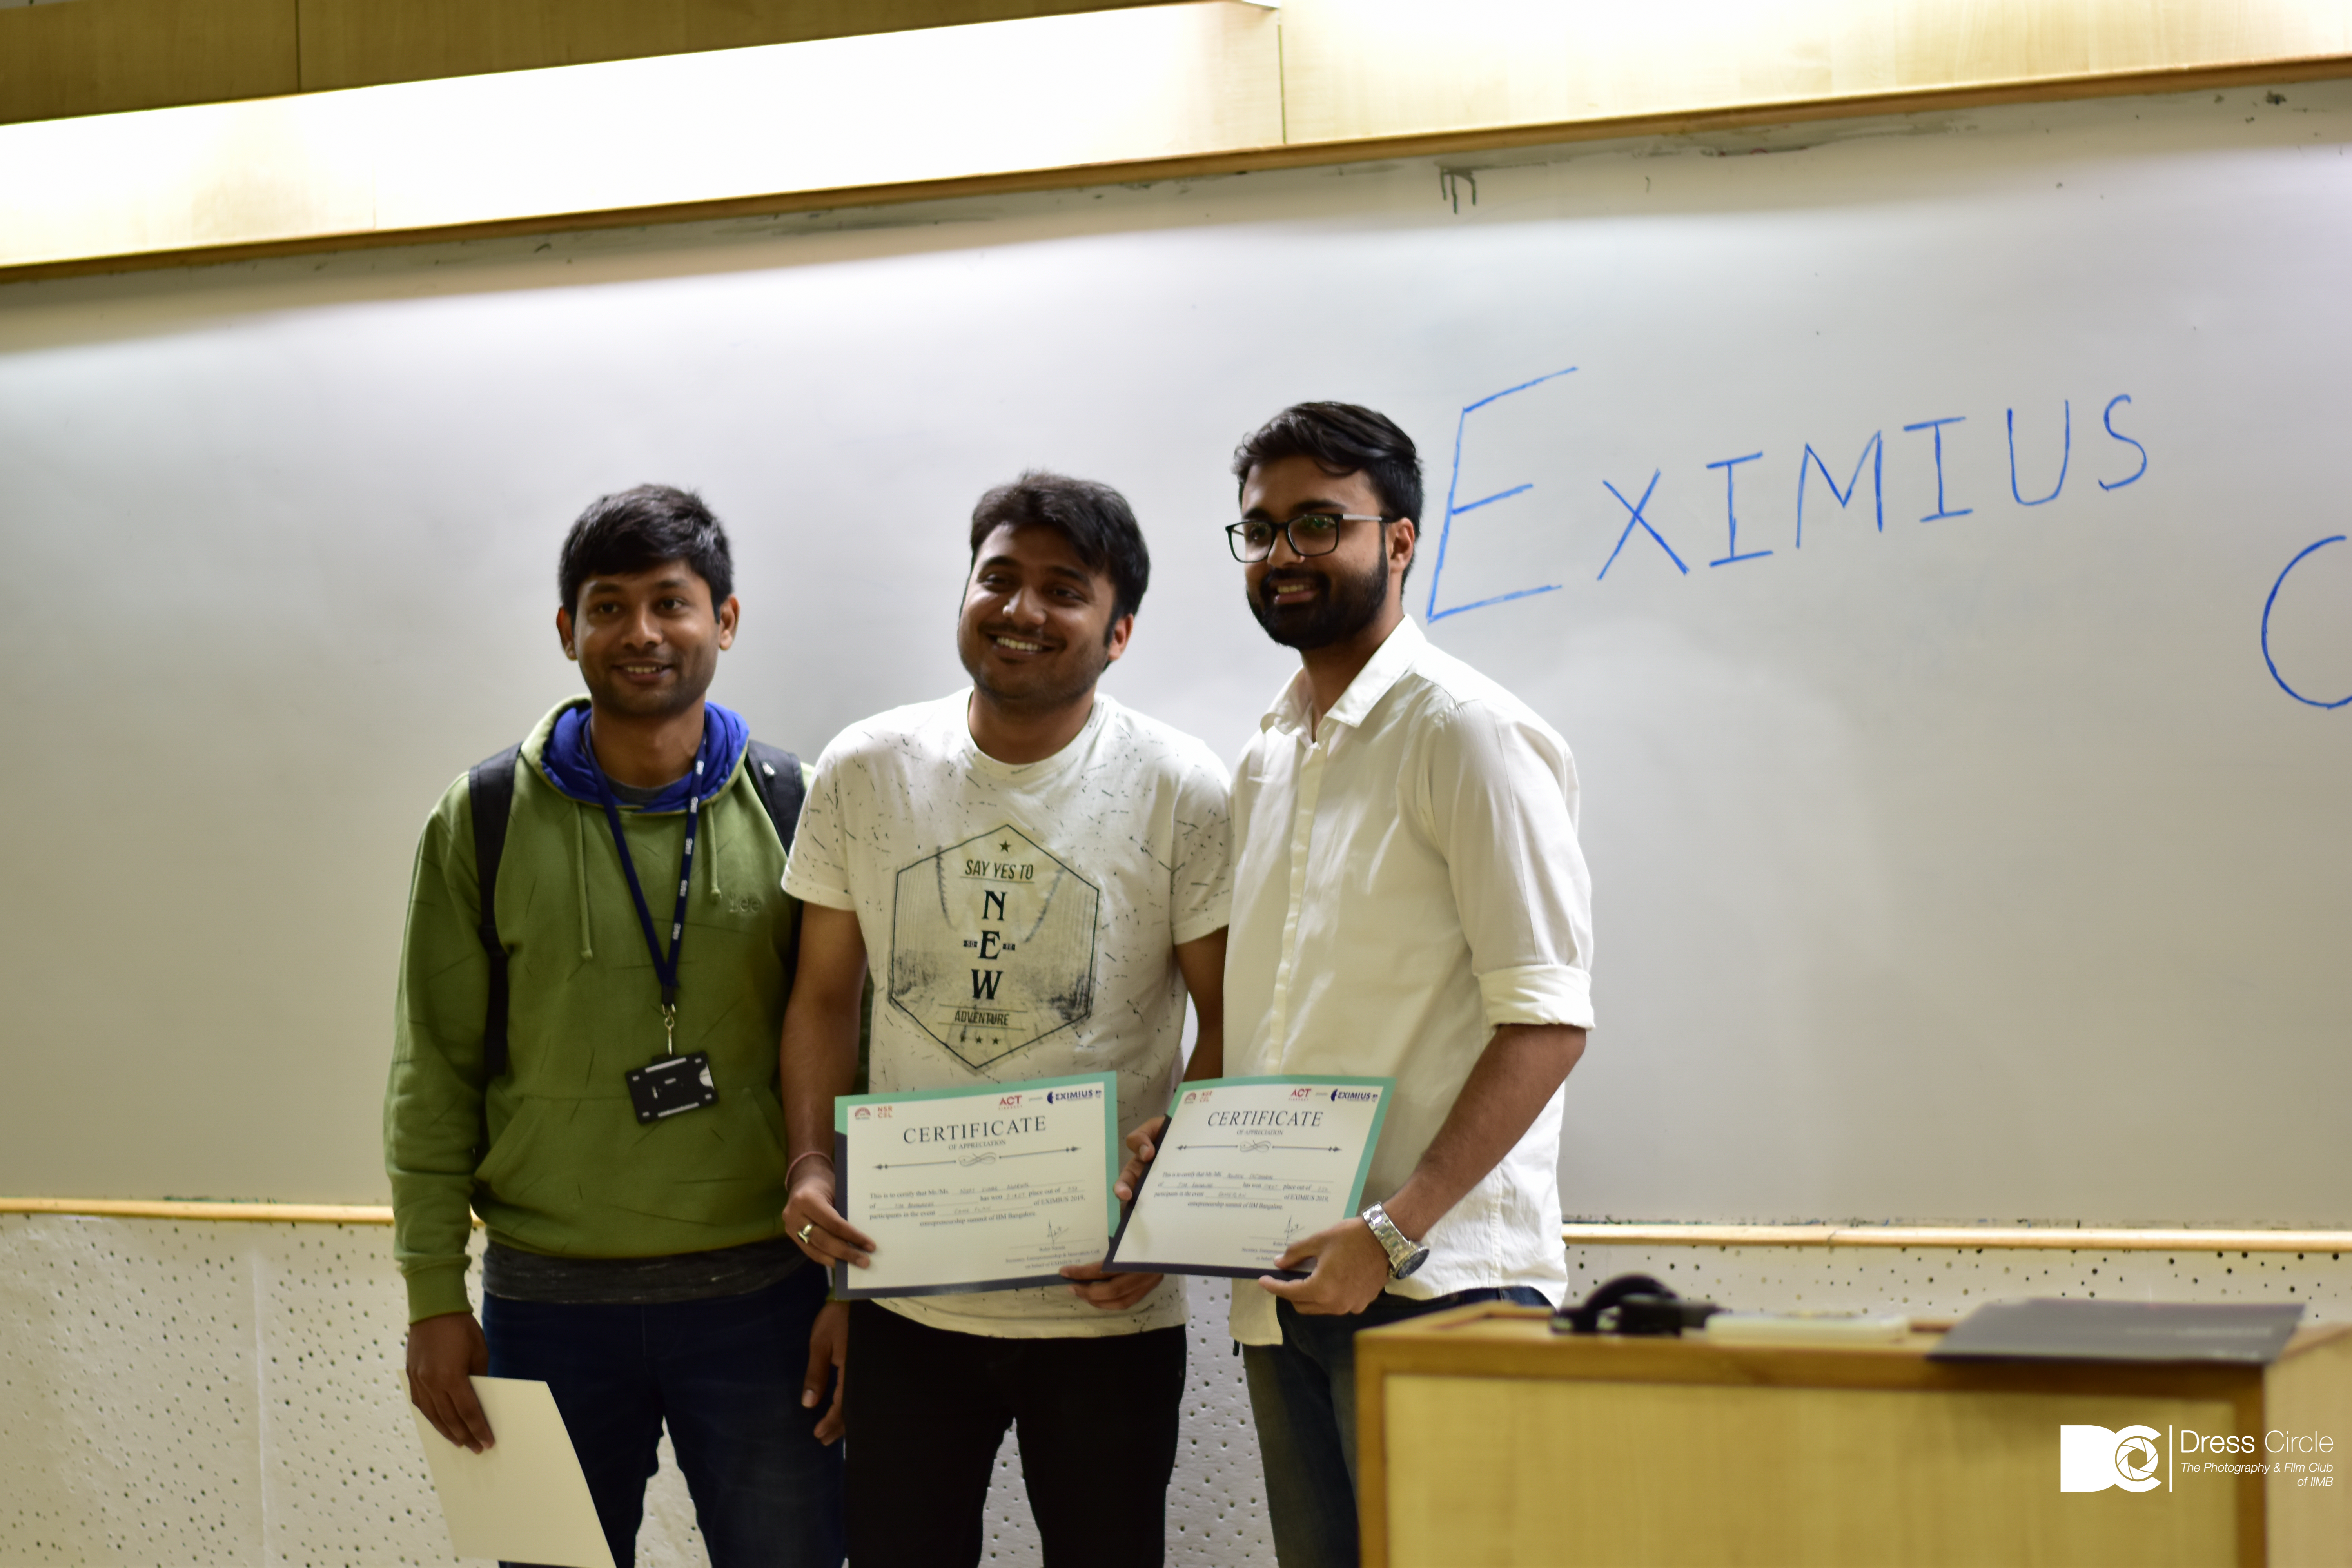
The students of IIM Bangalore, in their entrepreneurship event ‘Eximius’, hosted an event called the ‘Game Plan’ to spread the importance of data analytics, using the platform of the most popular religion of India ‘Cricket’. The objective of the event was to recreate the 2019 World Cup team based on data analytics and decision sciences. Easier said than done. The event saw more than 750 participants across different top-tier colleges. Our team comprising Praveen Sasidharan, Niraj Agarwal and Sakthivasan D, students of the EPGP Class of 2019-20 won the competition as we had put together a team that was closest to the actual World Cup 2019 team.
Strategy, step by step
The event consisted of 4 rounds. In the first round, all the participants were given a data file, which comprised of player ID and team ID (player name and team name were masked), and lots of batting and bowling statistics like the number of 6s, 4s, the batting order, runs scored etc. were provided match-by-match. The objective was to choose a team of 20 from the list. Our team ran a cluster analysis as a first step. The variables used for the cluster analysis terms like number of balls faced, number of runs made, number of matches played, batting order, number of wickets taken etc. Our idea was that these variables would help separate the various types of players in the the team namely batsmen, bowlers and all-rounders. For eg: the batsman cluster would have players who batted more number of balls and made more runs. The logic that we had used aligned with the result of the cluster analysis wherein we saw 3 significant clusters being formed. We then created new derived variables like strike rate and economy rate which enabled us to pick the best from the lot. We next started constructing logic for each cluster to select the players. An example is that for an opening batsman a player must have a strike rate above 85%, an average score of 45 and must have played in the 1st and 2nd position significant number of times earlier. Similarly, we constructed logics for bowlers and all-rounders and then put together a team of 20.
For Round 2, some more variables were revealed, and we were asked to prune our player list from 20 to 15. We went through a similar process as Round-1 and created a 15-player list. The final rounds, Round 3 and Round 4 were conducted on campus during the event. We were given some more data to further fine-tune the list and bring it down to a final playing 11. The new data basically comprised of the World Cup knock off stage’s performance. Using several rules, we knocked off more players and arrived at a final list. Our list matched 9 out of the 11 players in the actual World Cup 2019 list. This was a moment of truth. The power of data analytics and its ability to predict real-time events was a key takeaway from the event. The event was an eye-opener and the icing on the cake was the taste of victory, especially after burning the midnight oil in the midst of the deadlines of the hectic MBA program.

